Ecology and water
Unit 1 Standards
|
|
|
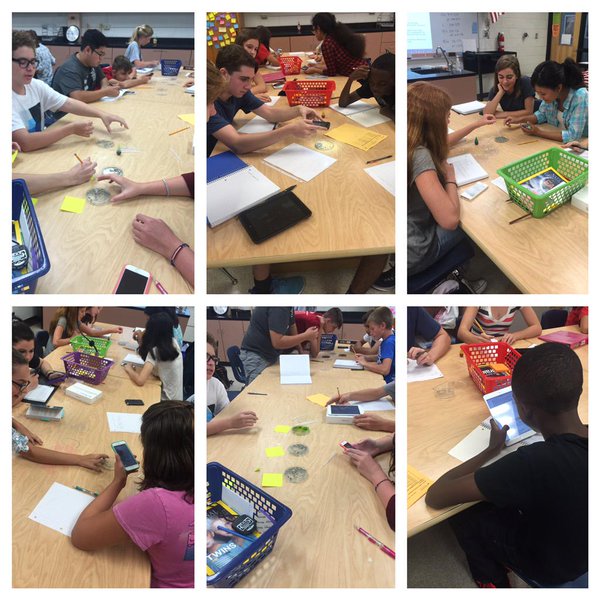
Day 1 | Inquiry Lab Intro
The purpose of this lab is to help you learn to take risks in science by designing lab procedures given supplies and desired outcomes. DO NOW 4 mins: On a sticky note (found in basket at table) write down three things you know about Biology and three things you want to learn this year in Biology. 1. Establish STEM cyber roles in preparation for 2. Coquina Clam Lab If you get stuck, use the videos below: Coquina Collection Coquina Stimulation 1 Coquina Stimulation 2 Coquina Dye 3. Homework Day 1 |
|
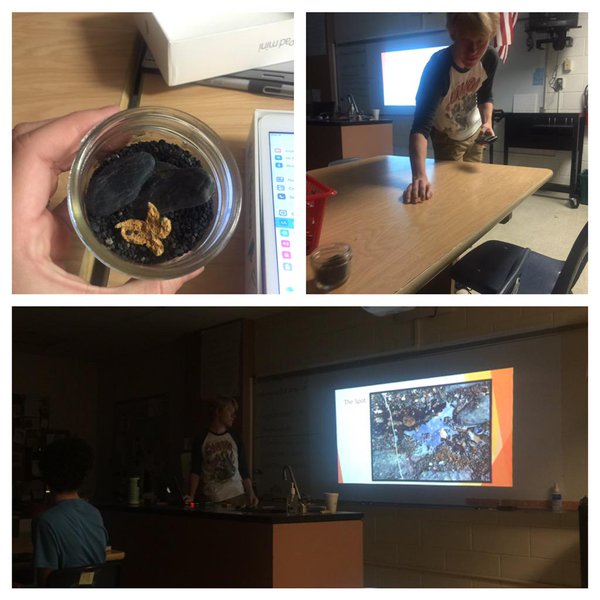
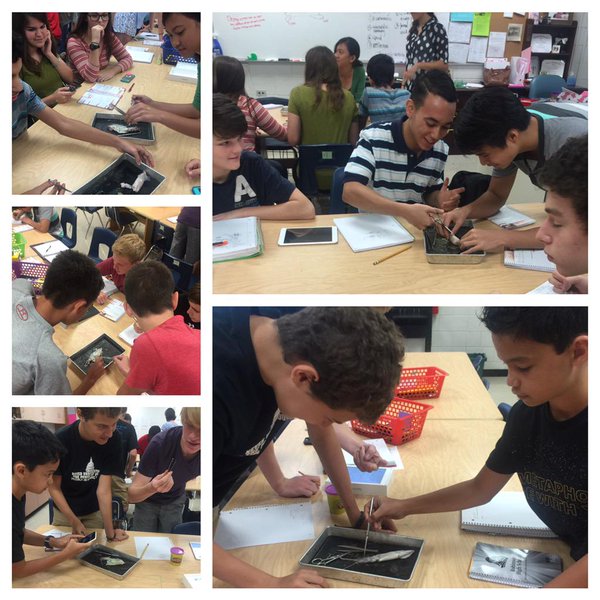
Day 2 | Squid Dissection
TSW analyze the anatomical features and ecological importance of squid using an inquiry lab. DO NOW 3 mins: Synthesize two HOTS questions for another student pertaining to concepts you learned via the coquina lab. HOTS questions begin with words such as "analyze, evaluate, create, design, develop, formulate, judge". Write on sticky note. Squid Lab 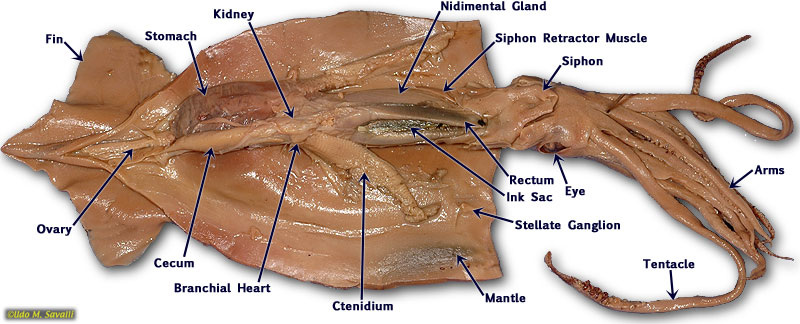
Design a 3D CAD model of the part of the squid you feel most contributes to its success as an ocean dwelling organism.
|
|
Day 3-5 | Summer Presentations- You are limited to 2-3 minutes :)
TSW use an article, website, and student led presentations to refine ecological understandings. TSW analyze energy consumption and distribution and will learn to use scientific naming using digital resources. Do Now 3: Read the article below and discuss with a partner Squid Article 1. the scientific relevance of chromatophores 2. the importance of modeling in scientific research 3. the importance of simulations in scientific research 4. analyze how our defense system could benefit from this research as well as how we can combat our enemies using this research Do Now 4: Answer the Test Prep attachment IYB Do NOW 5: DO NOW 5 Use this article to: 1. analyze the importance of a Keystone Species 2. Create a food web of the sea otter 3. Analyze the importance of the following: foundation species, umbrella species, and indicator species Homework Day 3- FORMAL Lab Write Up Homework Day 4- Gizmos Homework Day 5- Gizmos |
Day 7 | Day 7 Directions
TSW analyze data and determine human action based on effects of The Dust Bowl. Complete the DO NOW under your other DO NOWs- check your answers with the answers provided. Then click "Dust Bowl" read and complete the chart after the page marked 117. The chart has the research question, claim, evidence, reasoning. The ONLY thing I need you to write in your notebook is your chart, and you may work in table groups if you prefer. Be sure to use the data as evidence :) Dust Bowl will be our next notebook entry. DO NOW 7: Answer the Test Prep attachment IYB Dust Bowl ADI 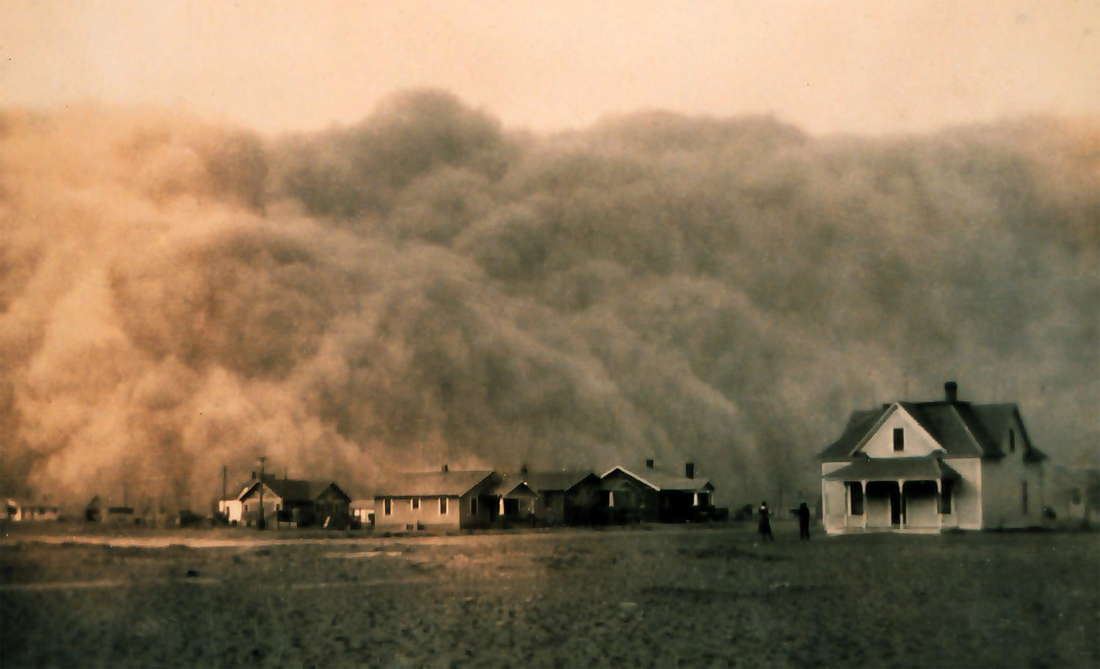
|
Day 8 | Directions
TSW analyze human policy, population growth, succession, limiting factors, and macromolecules as these concepts relate the the Dust Bowl.
Dust Bowl: Macromolecules, Policy, Human Impact, Succession, Biomes, Limiting Factor, Population Stats
Complete the DO NOW below under your other DO NOWs- check your answers with the answers provided. Then click "Dust Bowl" and follow MY instructions below. The instructions in the document ARE WRONG. FOLLOW MINE. ONLY WORK WITH YOUR TABLE. Every one write in his/her own binder and whatever you don't finish in class is HOMEWORK J
ONLY FOLLOW MY INSTRUCTIONS:
1. Read "The Dust Bowl" then make a chart on a new page IYB (in your binder) comparing and contrasting: How human practices contributed to the dust bowl VS How US policy decisions were influenced by lessons learned during the dust bowl.
2. Read "Food Chain Healthy Grass etc..." data and complete chart titled "Food Chain Analysis Using CEJ Model" and the three questions on the next page IYB on a new page.
3. Read "Finding The Right Mix of Carbs, Proteins, and Fats". Then research the basic structure and the body's use of carbs, of proteins, and of fats and record via a three column chart IYB on a new page.
4. Look at the drawing of Primary Succession and Secondary Succession: IYB on a new page, Make a chart comparing and contrasting primary VS secondary succession.
5. Read "Interesting Facts About Temperate Grasslands". IYB below primary VS secondary succession, record the definition and characteristics in general of biomes.
6. Using rabbit data pages and "The Virtual Nature Trail at Penn State..." IYB on a new page, complete "Rabbit Population By Season Using CEJ" chart.
7. Answer all questions 1-9 titled "Dust Bowl Reflection and Some Just in Time Teaching" IYB on a new page. This document is found after the "What should your family do to survive the winter?" chart from last class at the beginning of the Dust Bowl document.
8. Answer the final question "Discuss how water acted as a limiting factor....?" IYB on a new page via complete sentences.
1. DO NOW 8: Answer the Test Prep attachment IYB
2. Dust Bowl ADI
Day 9 | Levels of Organization, Consumers of Energy, Scientific Naming, Energy Pyramid, Population Dynmaics
1. Do Now 9: Answer the Test Prep IYB
2. Levels of Organization
Differentiate between the following levels of organization: IYN
atom, molecule, organelle, cell, tissue, organ, organ system, organism, population, community, ecosystem, biosphere.
3. Use the website "Consumers of Energy" to differentiate between herbivores, carnivores, omnivores, and decomposers. Play the game and write an explanation for each type of energy consumer. Analyze the importance of each in maintaining ecosystems. IYB
4. Use the website Energy Pyramid to draw and analyze your own energy pyramid. Include 10% law. IYB. The create a CAD model that represents an Energy pyramid.
Population Dynamics, Biogeochemical cycles
Nutrient Flow
Day 10 | Directions
ii.List factors that contribute to population dynamics and analyze how each factor can potentially affect population dynamics.
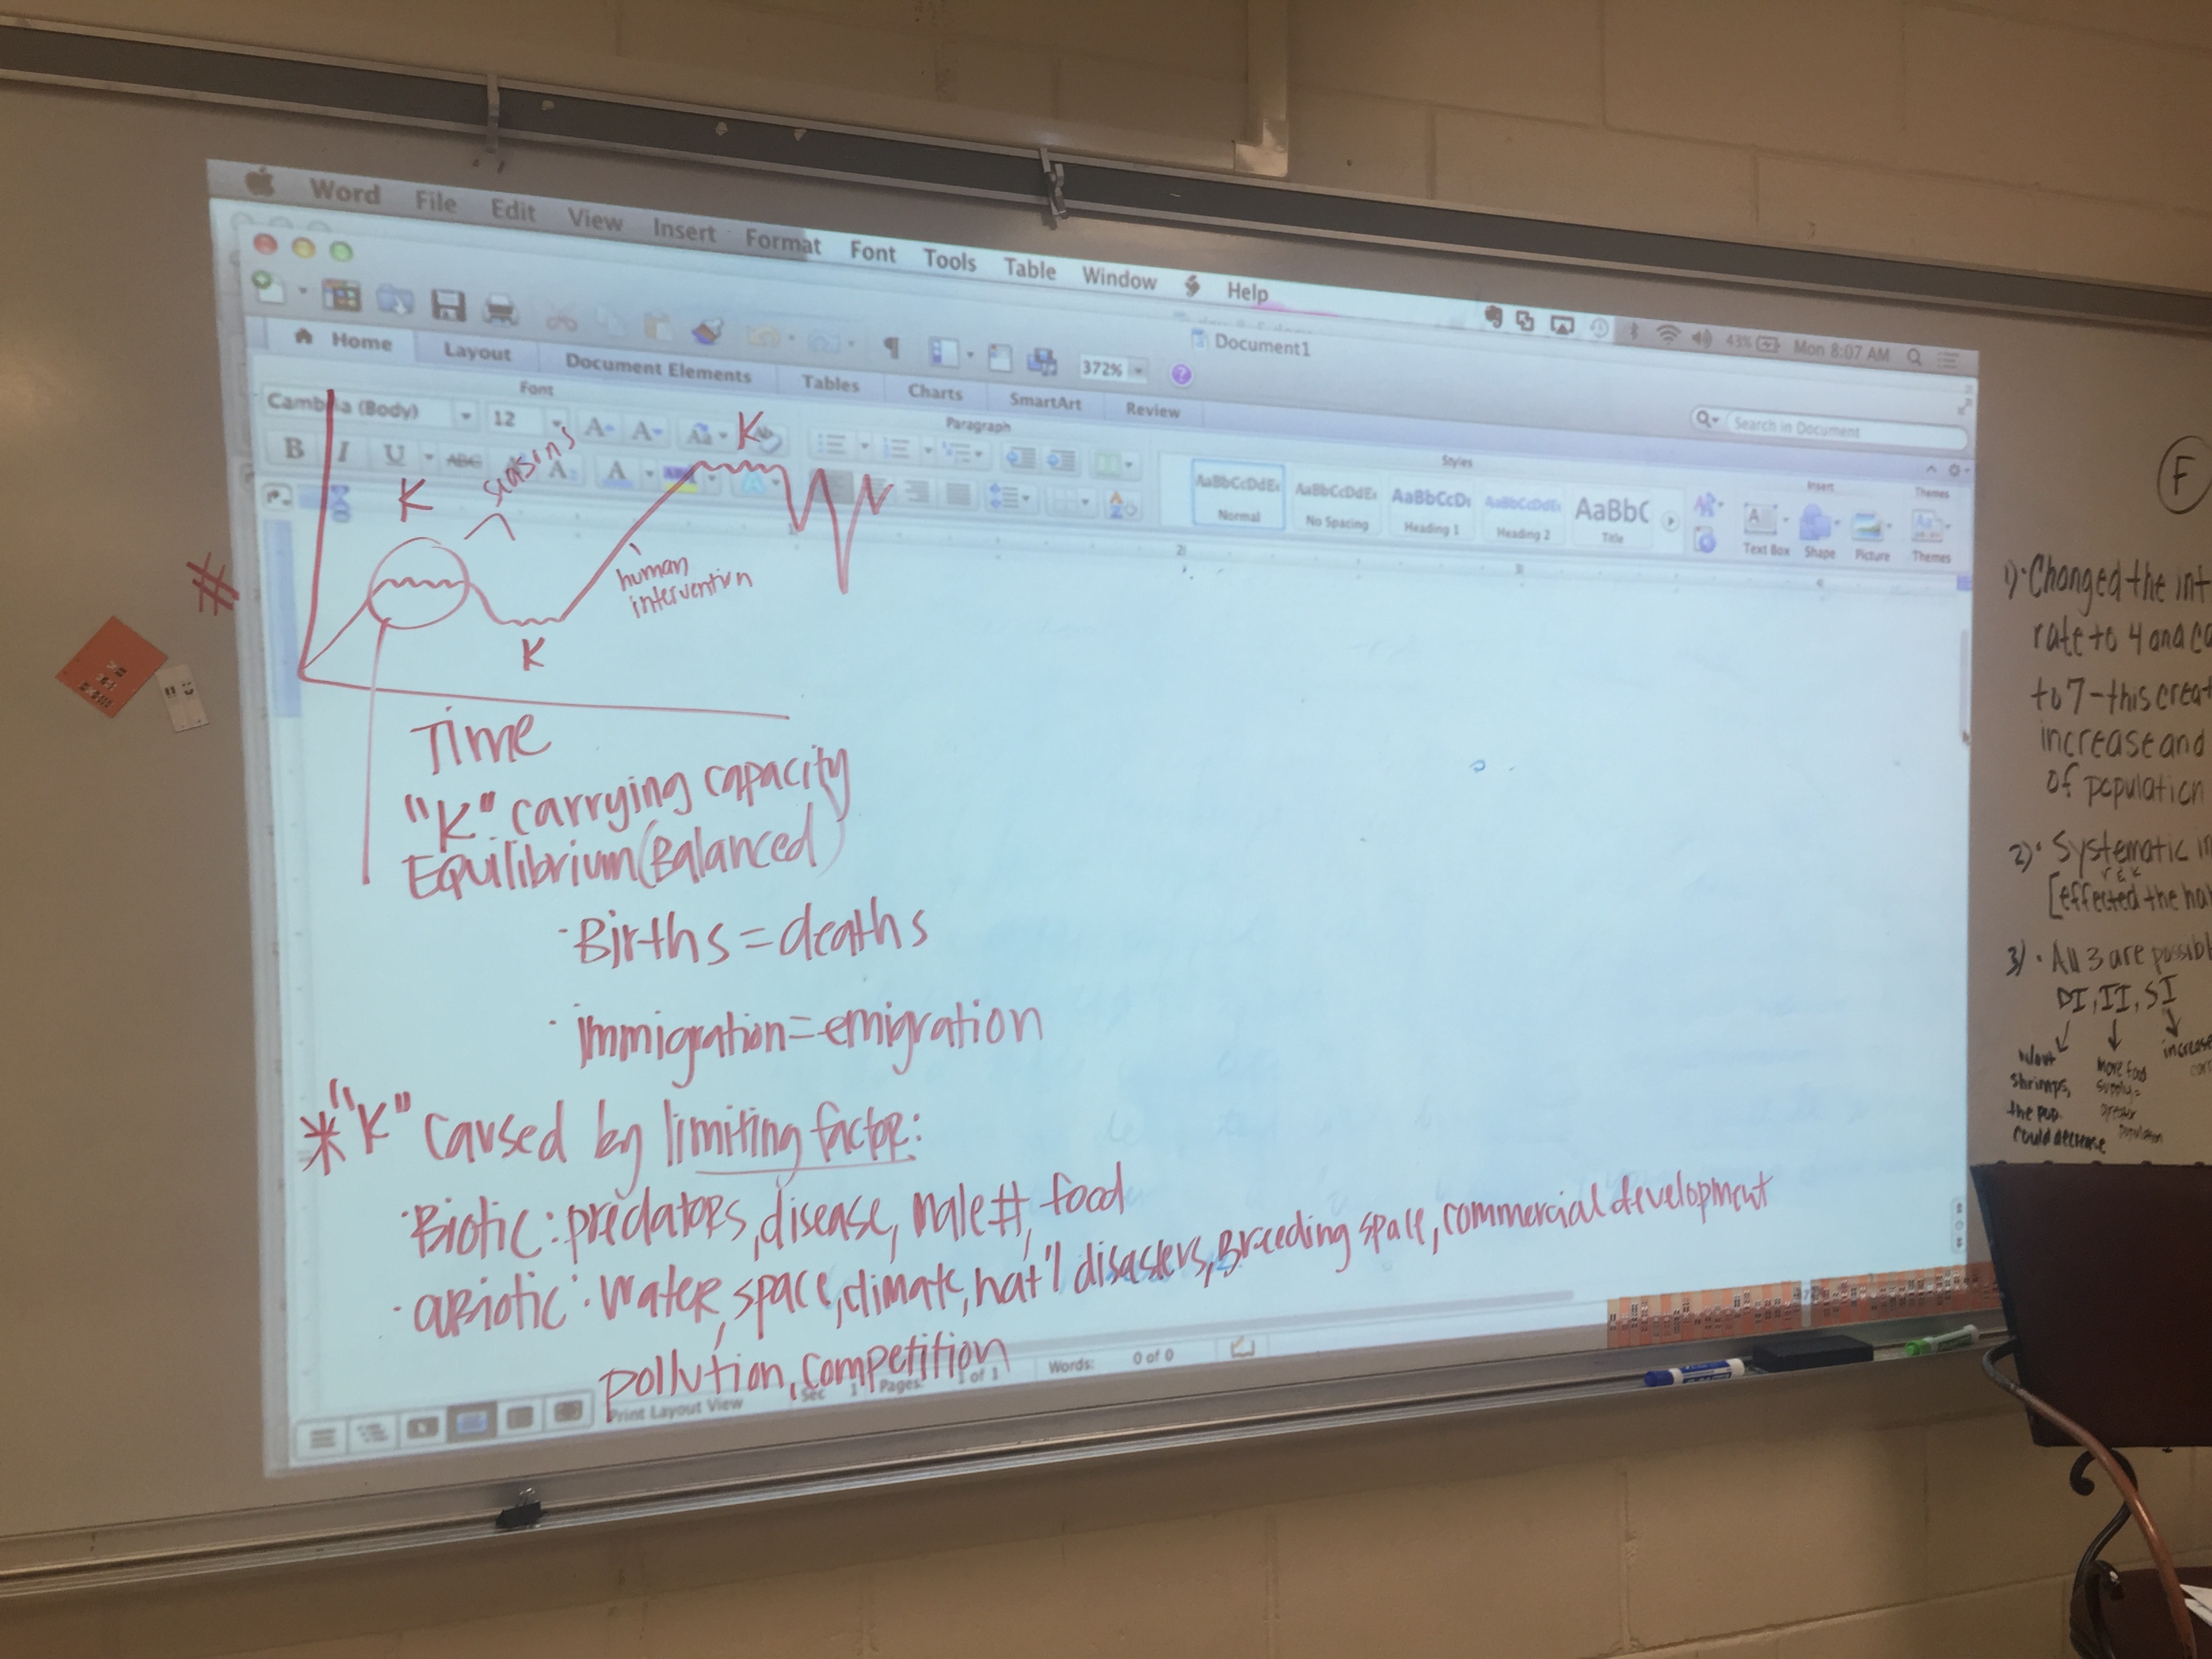
iii.Define “k” (carrying capacity) and analyze what determines “k”?
iv.Explain what density dependent means pertaining to population dynamics.
v.Using your knowledge, deduce what density independent factors may exist. Explain how these factors are density independent.
2. Extend your learning by completing: Population Dynamics 2
Understand: population size is determined by: births, deathc, immigration, emigration, and both biotic and abiotic limiting factors.
3. Homework: Squid Lab corrections, Rock Cycle Gizmo with SES and Water Cycle Gizmo with SES, Study for quiz
Pics:
Density Dependent v Density Independent Limiting Factors
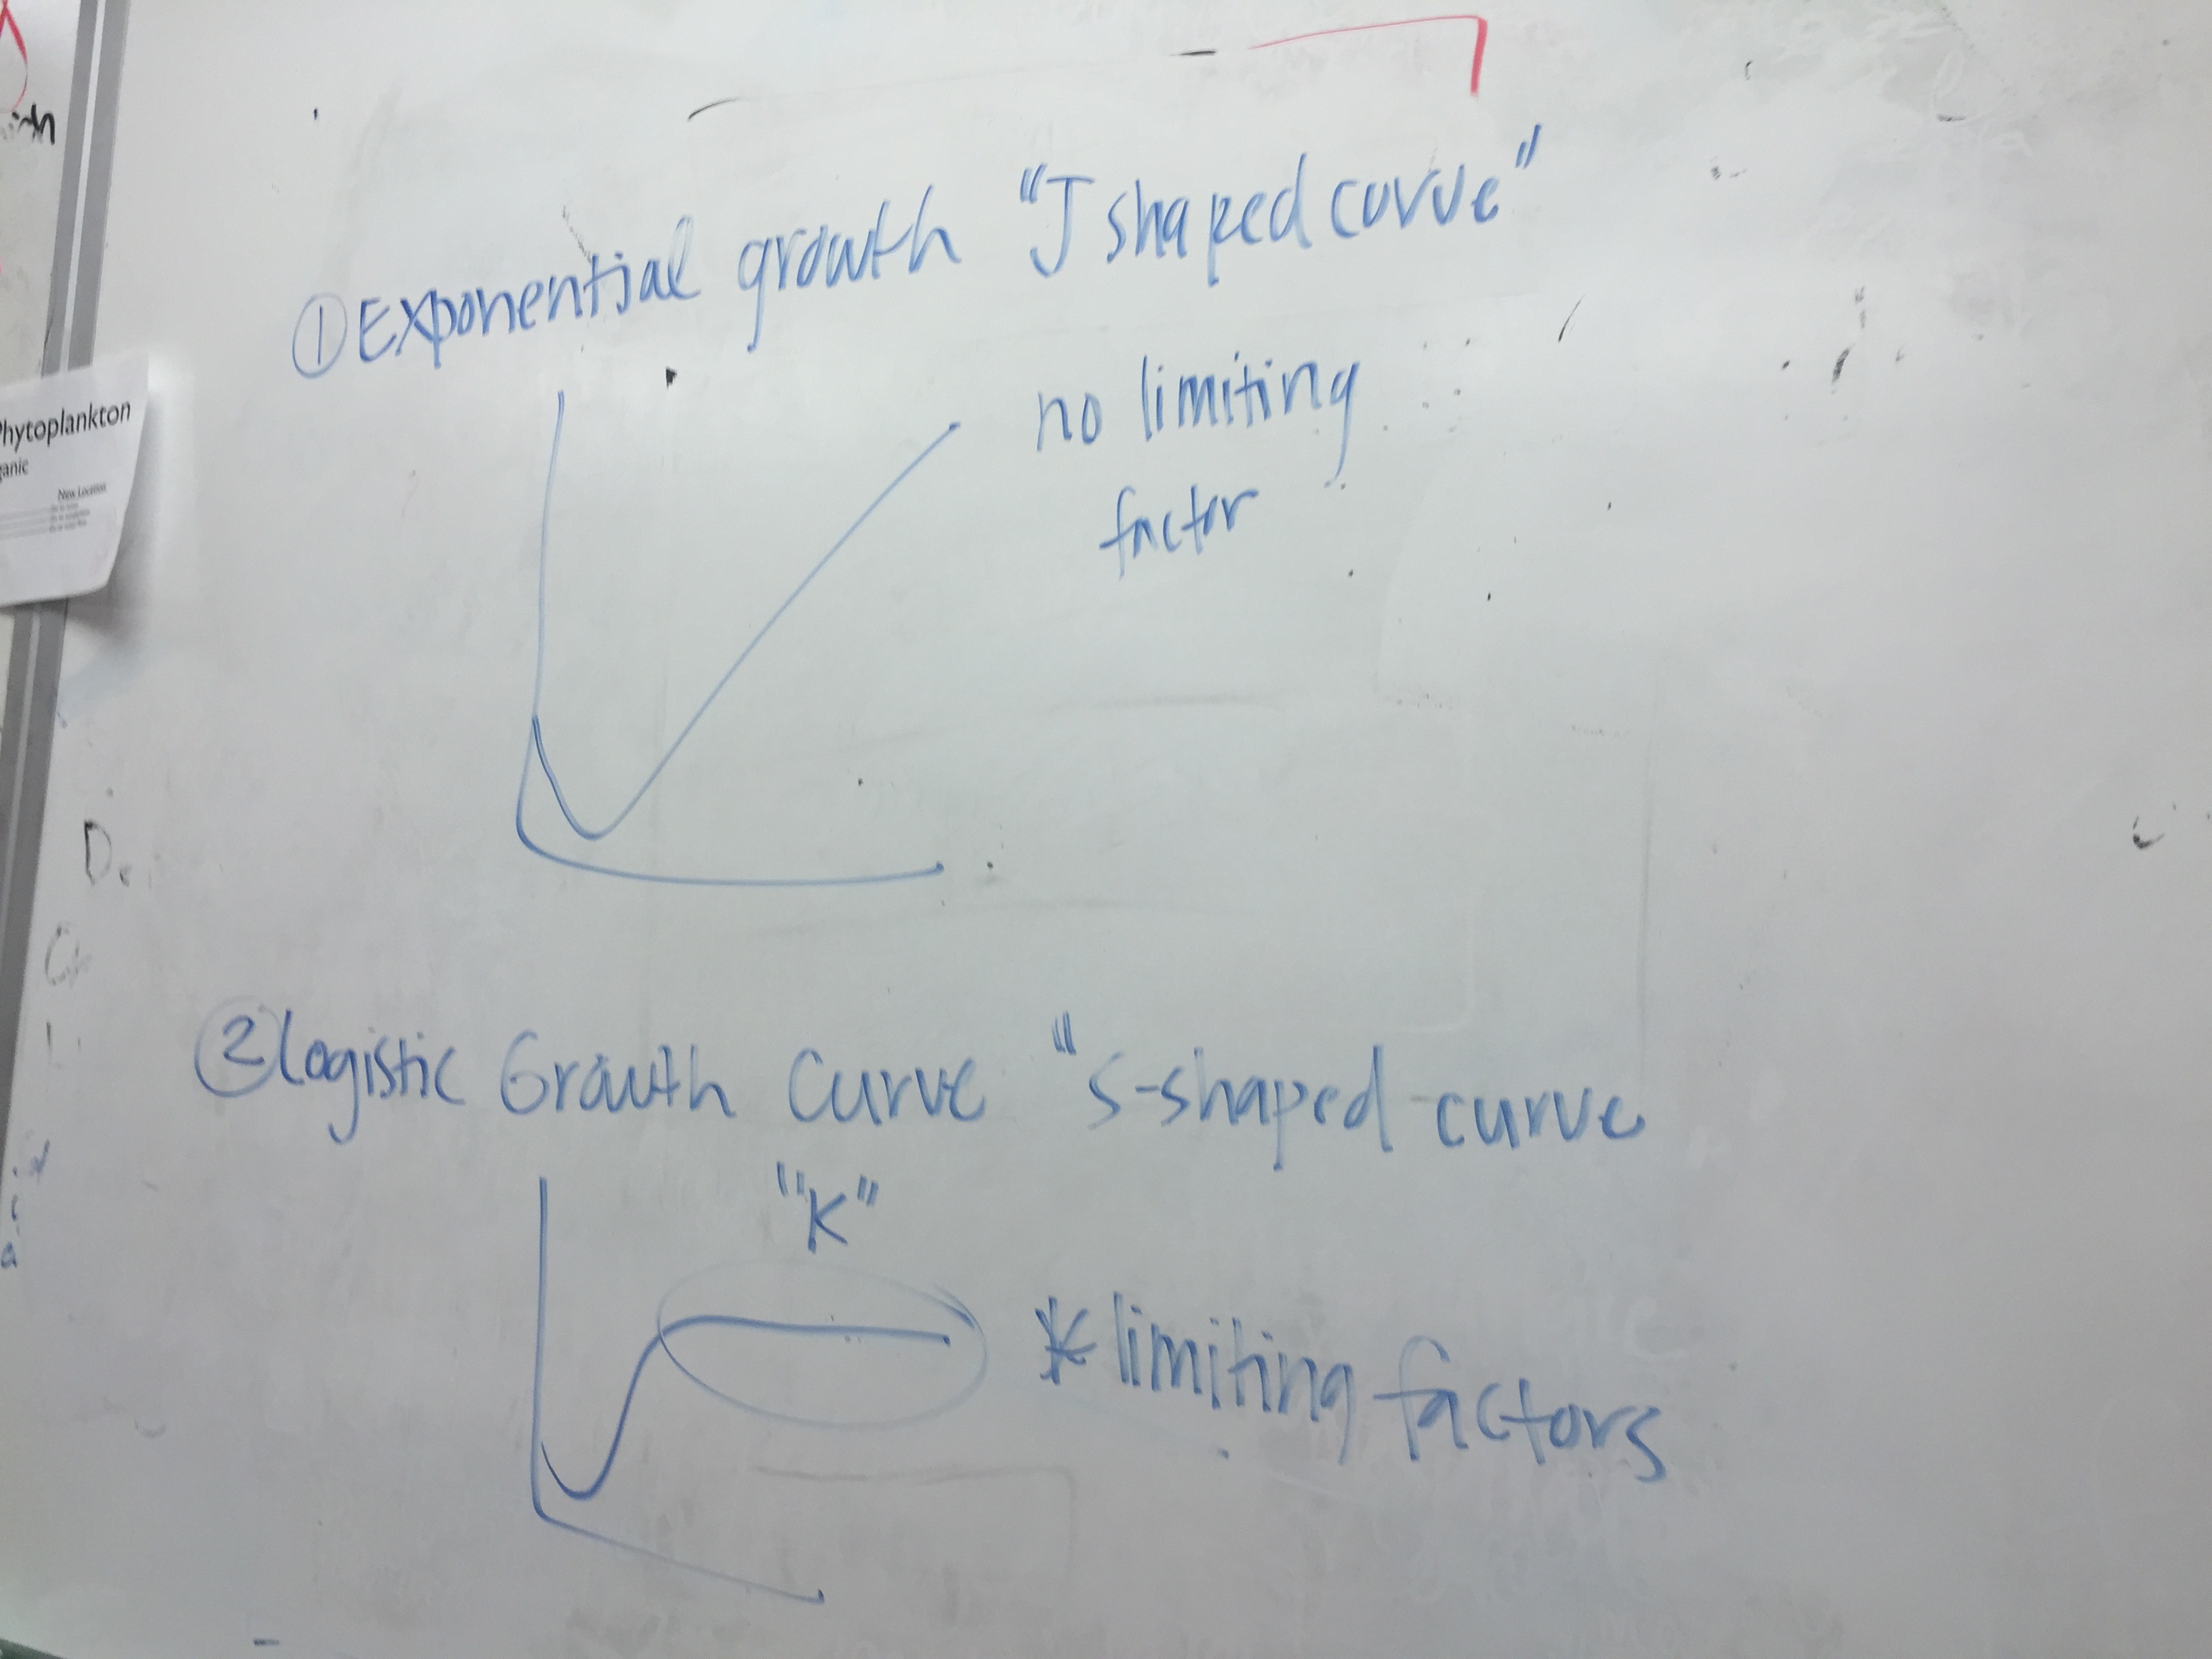
Growth Curve
- Read Background through Student Objectives Population Dynamics 1
- Answer the following IYB (in your binder)
ii.List factors that contribute to population dynamics and analyze how each factor can potentially affect population dynamics.
iii.Define “k” (carrying capacity) and analyze what determines “k”?
iv.Explain what density dependent means pertaining to population dynamics.
v.Using your knowledge, deduce what density independent factors may exist. Explain how these factors are density independent.
- As a table, Complete Activity Procedure Part 1 and record IYB
- Independently, Complete Activity Procedure Part 2 and record IYB
- As a table, complete Part 3: Fisheries Manager Scenario #1 and record answers on delegated white board space. We will be sharing and comparing answers as a class.
- As a table, complete Part 3: Fisheries Manager Scenario #1 and record answers on delegated white board space. We will be sharing and comparing answers as a class.
2. Extend your learning by completing: Population Dynamics 2
Understand: population size is determined by: births, deathc, immigration, emigration, and both biotic and abiotic limiting factors.
3. Homework: Squid Lab corrections, Rock Cycle Gizmo with SES and Water Cycle Gizmo with SES, Study for quiz
Pics:
Density Dependent v Density Independent Limiting Factors
Growth Curve
Day 11 | Review Day
TSW refine ecological understandings using previous work.
Human Impact on Everglades
3D design a machine or apparatus you feel can help combat negative human impact on the everglades. See article for more information. You will need to provide an explanation of your design, estimated costs of production, and potential short and long term effects on the native plant and animal species. Display answers using a digital piece.
Rubric here.
Day 12 | Ocean Levels Directions
TSW analyze ocean levels by using research and creating a model.
1. Do Now- Study for quiz and turn in homework.
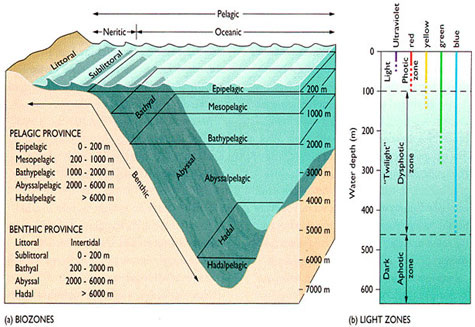
2. Using Ocean Levels Website, create a project including a 3D CAD model with your table of the ocean levels. Also record IYB (you may print out a picture of project and may type and save information to print out later) Include:
Level Help
1. Sunlight available vs energy
2. 3-4 organisms found in each level
3. human impact on 2 levels
4. Explain the general distribution of life in aquatic ecosystems as a function of
a. chemistry (include: pH, oxygen, CO2, nitrogen, phosphorus, and salinity)
b. geography (include: depth, latitude, underwater topography, proximity to land)
c. light
d. temperature
3. Using this page IYB:
1. differentiate biotic v abiotic
2. food chain v food web
3. trophic level importance
4. 4 types of symbiosis and example of each
5. importance of competition and of predation
TSW analyze ocean levels by using research and creating a model.
1. Do Now- Study for quiz and turn in homework.
2. Using Ocean Levels Website, create a project including a 3D CAD model with your table of the ocean levels. Also record IYB (you may print out a picture of project and may type and save information to print out later) Include:
Level Help
1. Sunlight available vs energy
2. 3-4 organisms found in each level
3. human impact on 2 levels
4. Explain the general distribution of life in aquatic ecosystems as a function of
a. chemistry (include: pH, oxygen, CO2, nitrogen, phosphorus, and salinity)
b. geography (include: depth, latitude, underwater topography, proximity to land)
c. light
d. temperature
3. Using this page IYB:
1. differentiate biotic v abiotic
2. food chain v food web
3. trophic level importance
4. 4 types of symbiosis and example of each
5. importance of competition and of predation
Day 13 and 14 | Cycling of Nutrients
Do Now 1: prepare for a 1 minute group presentation and questioning on Ocean Levels project.
Do Now part 2 in link in power point you will see when opening the above link
Do Now 14: Use this article to compare and contrast niche versus habitat
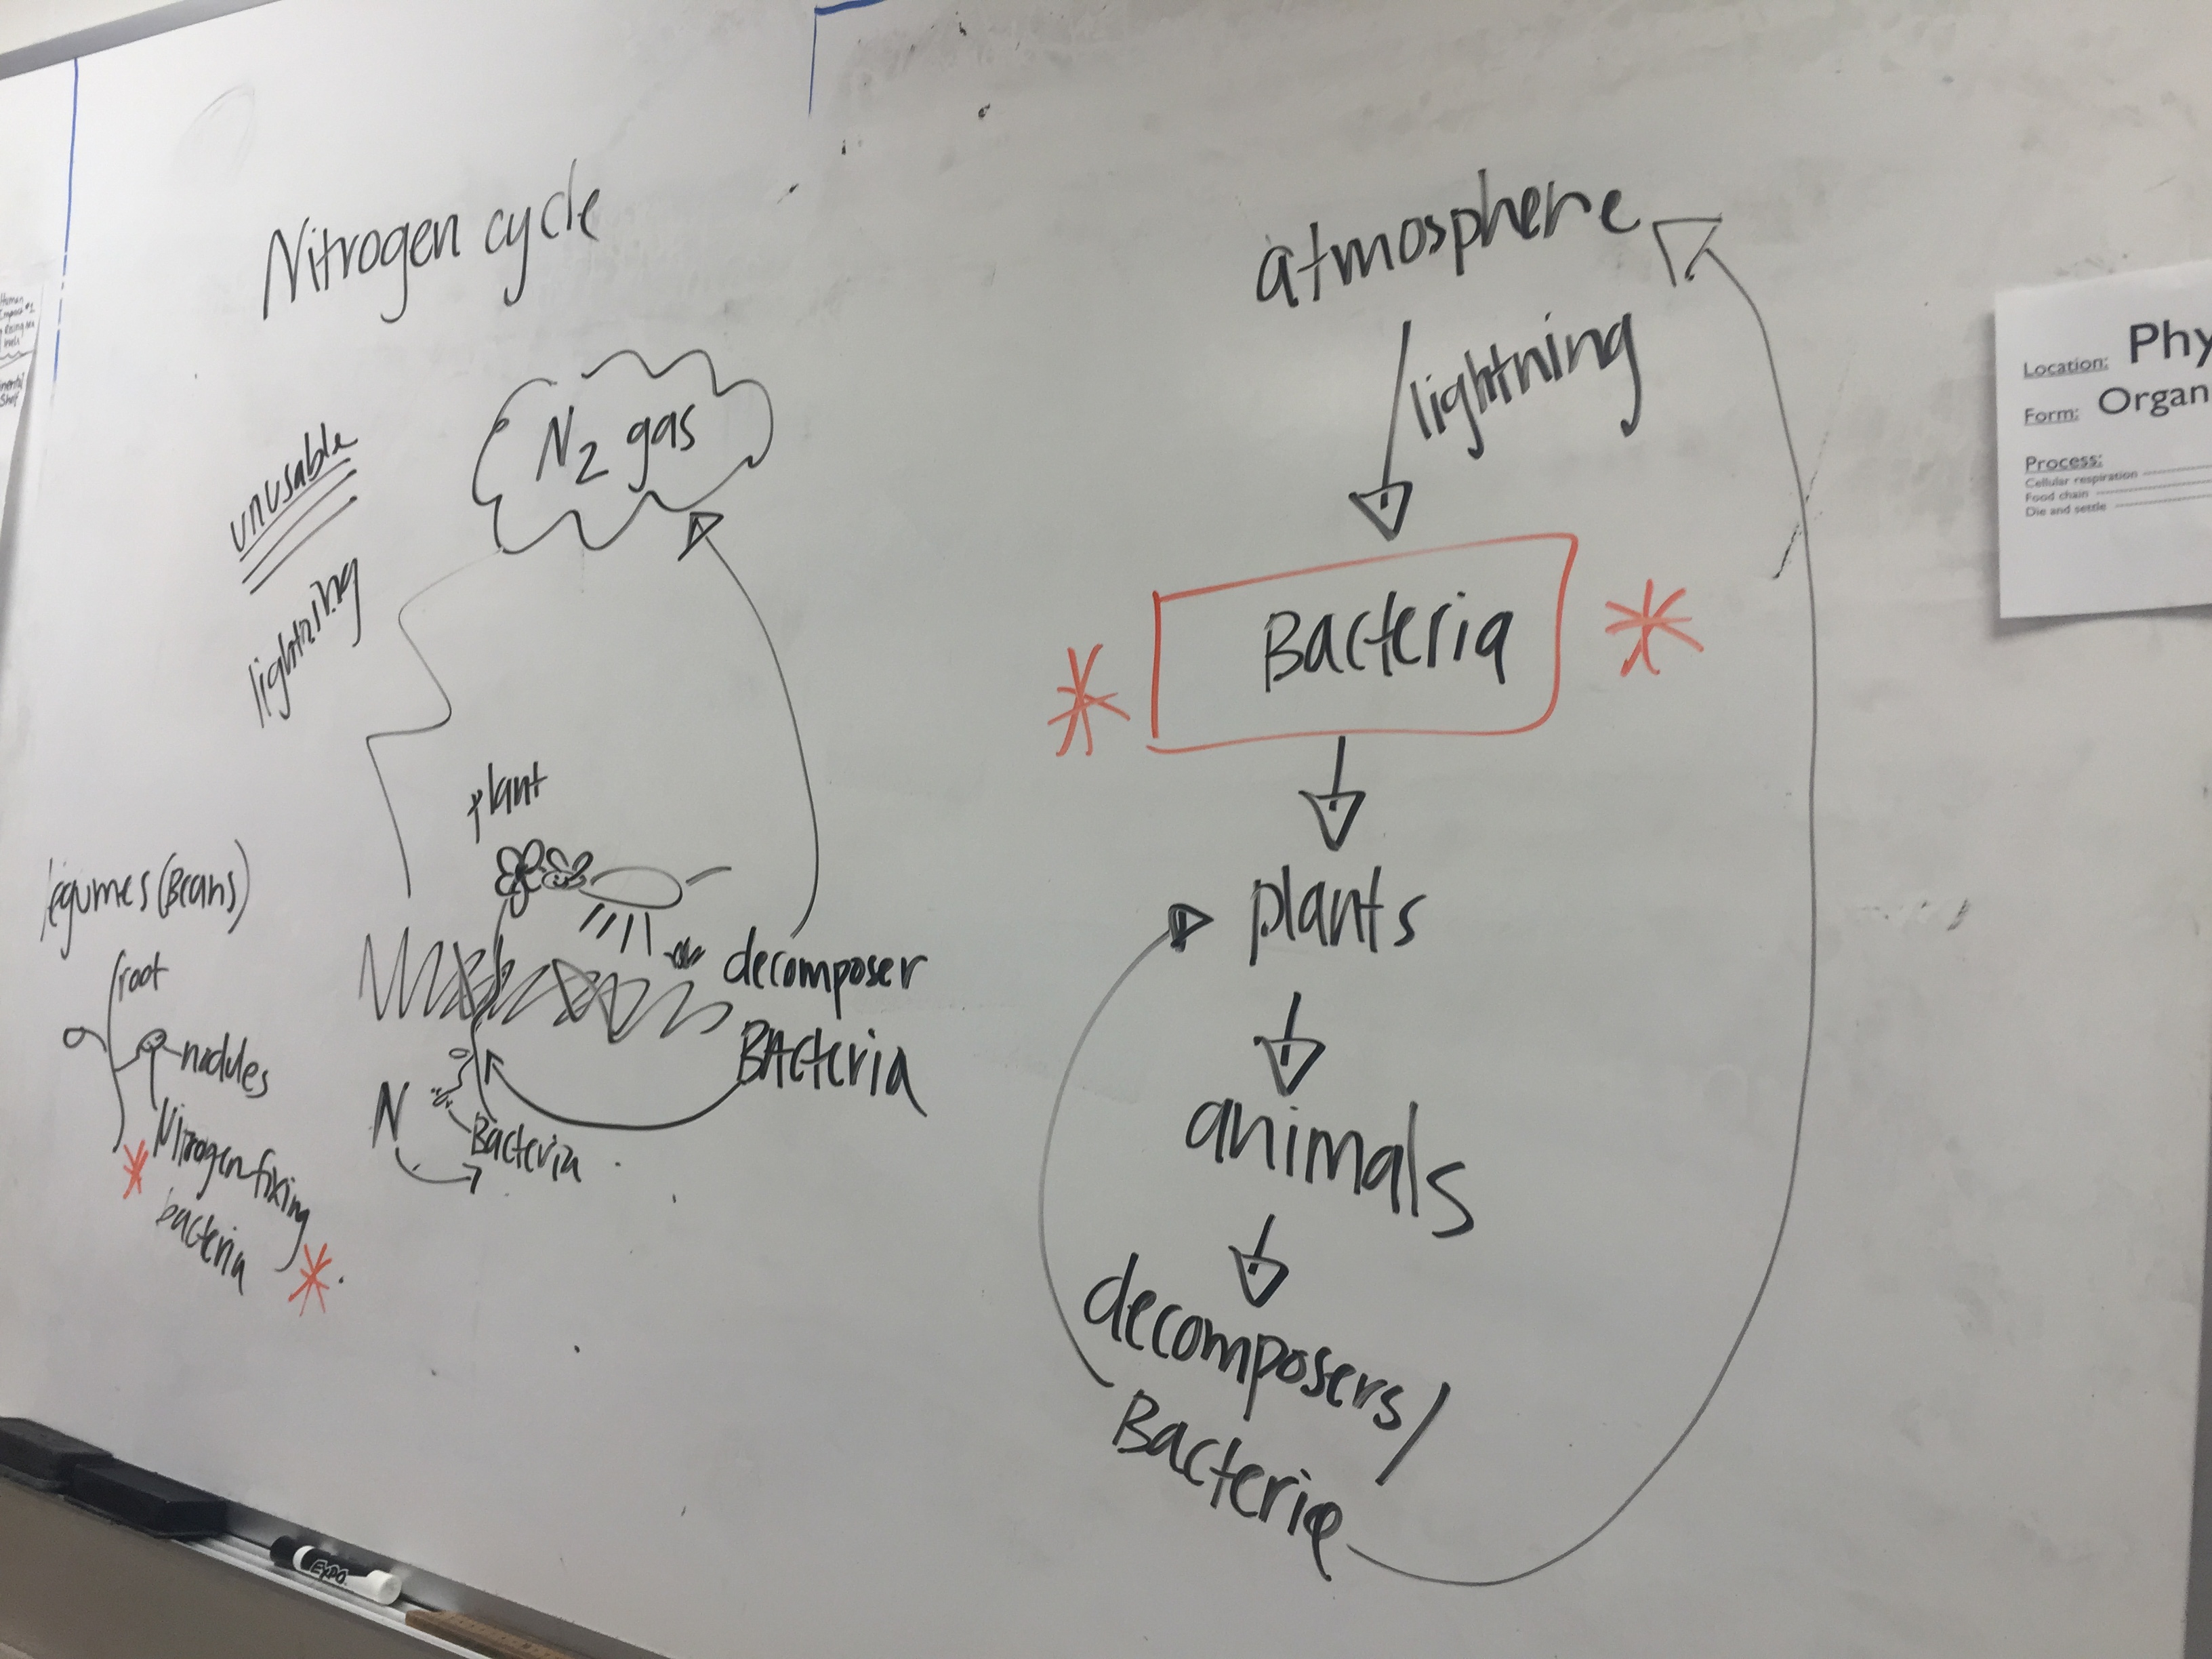
TSW analyze nutrient cycles using county provided biogeochemicals ADI.
Nitrogen Cycle
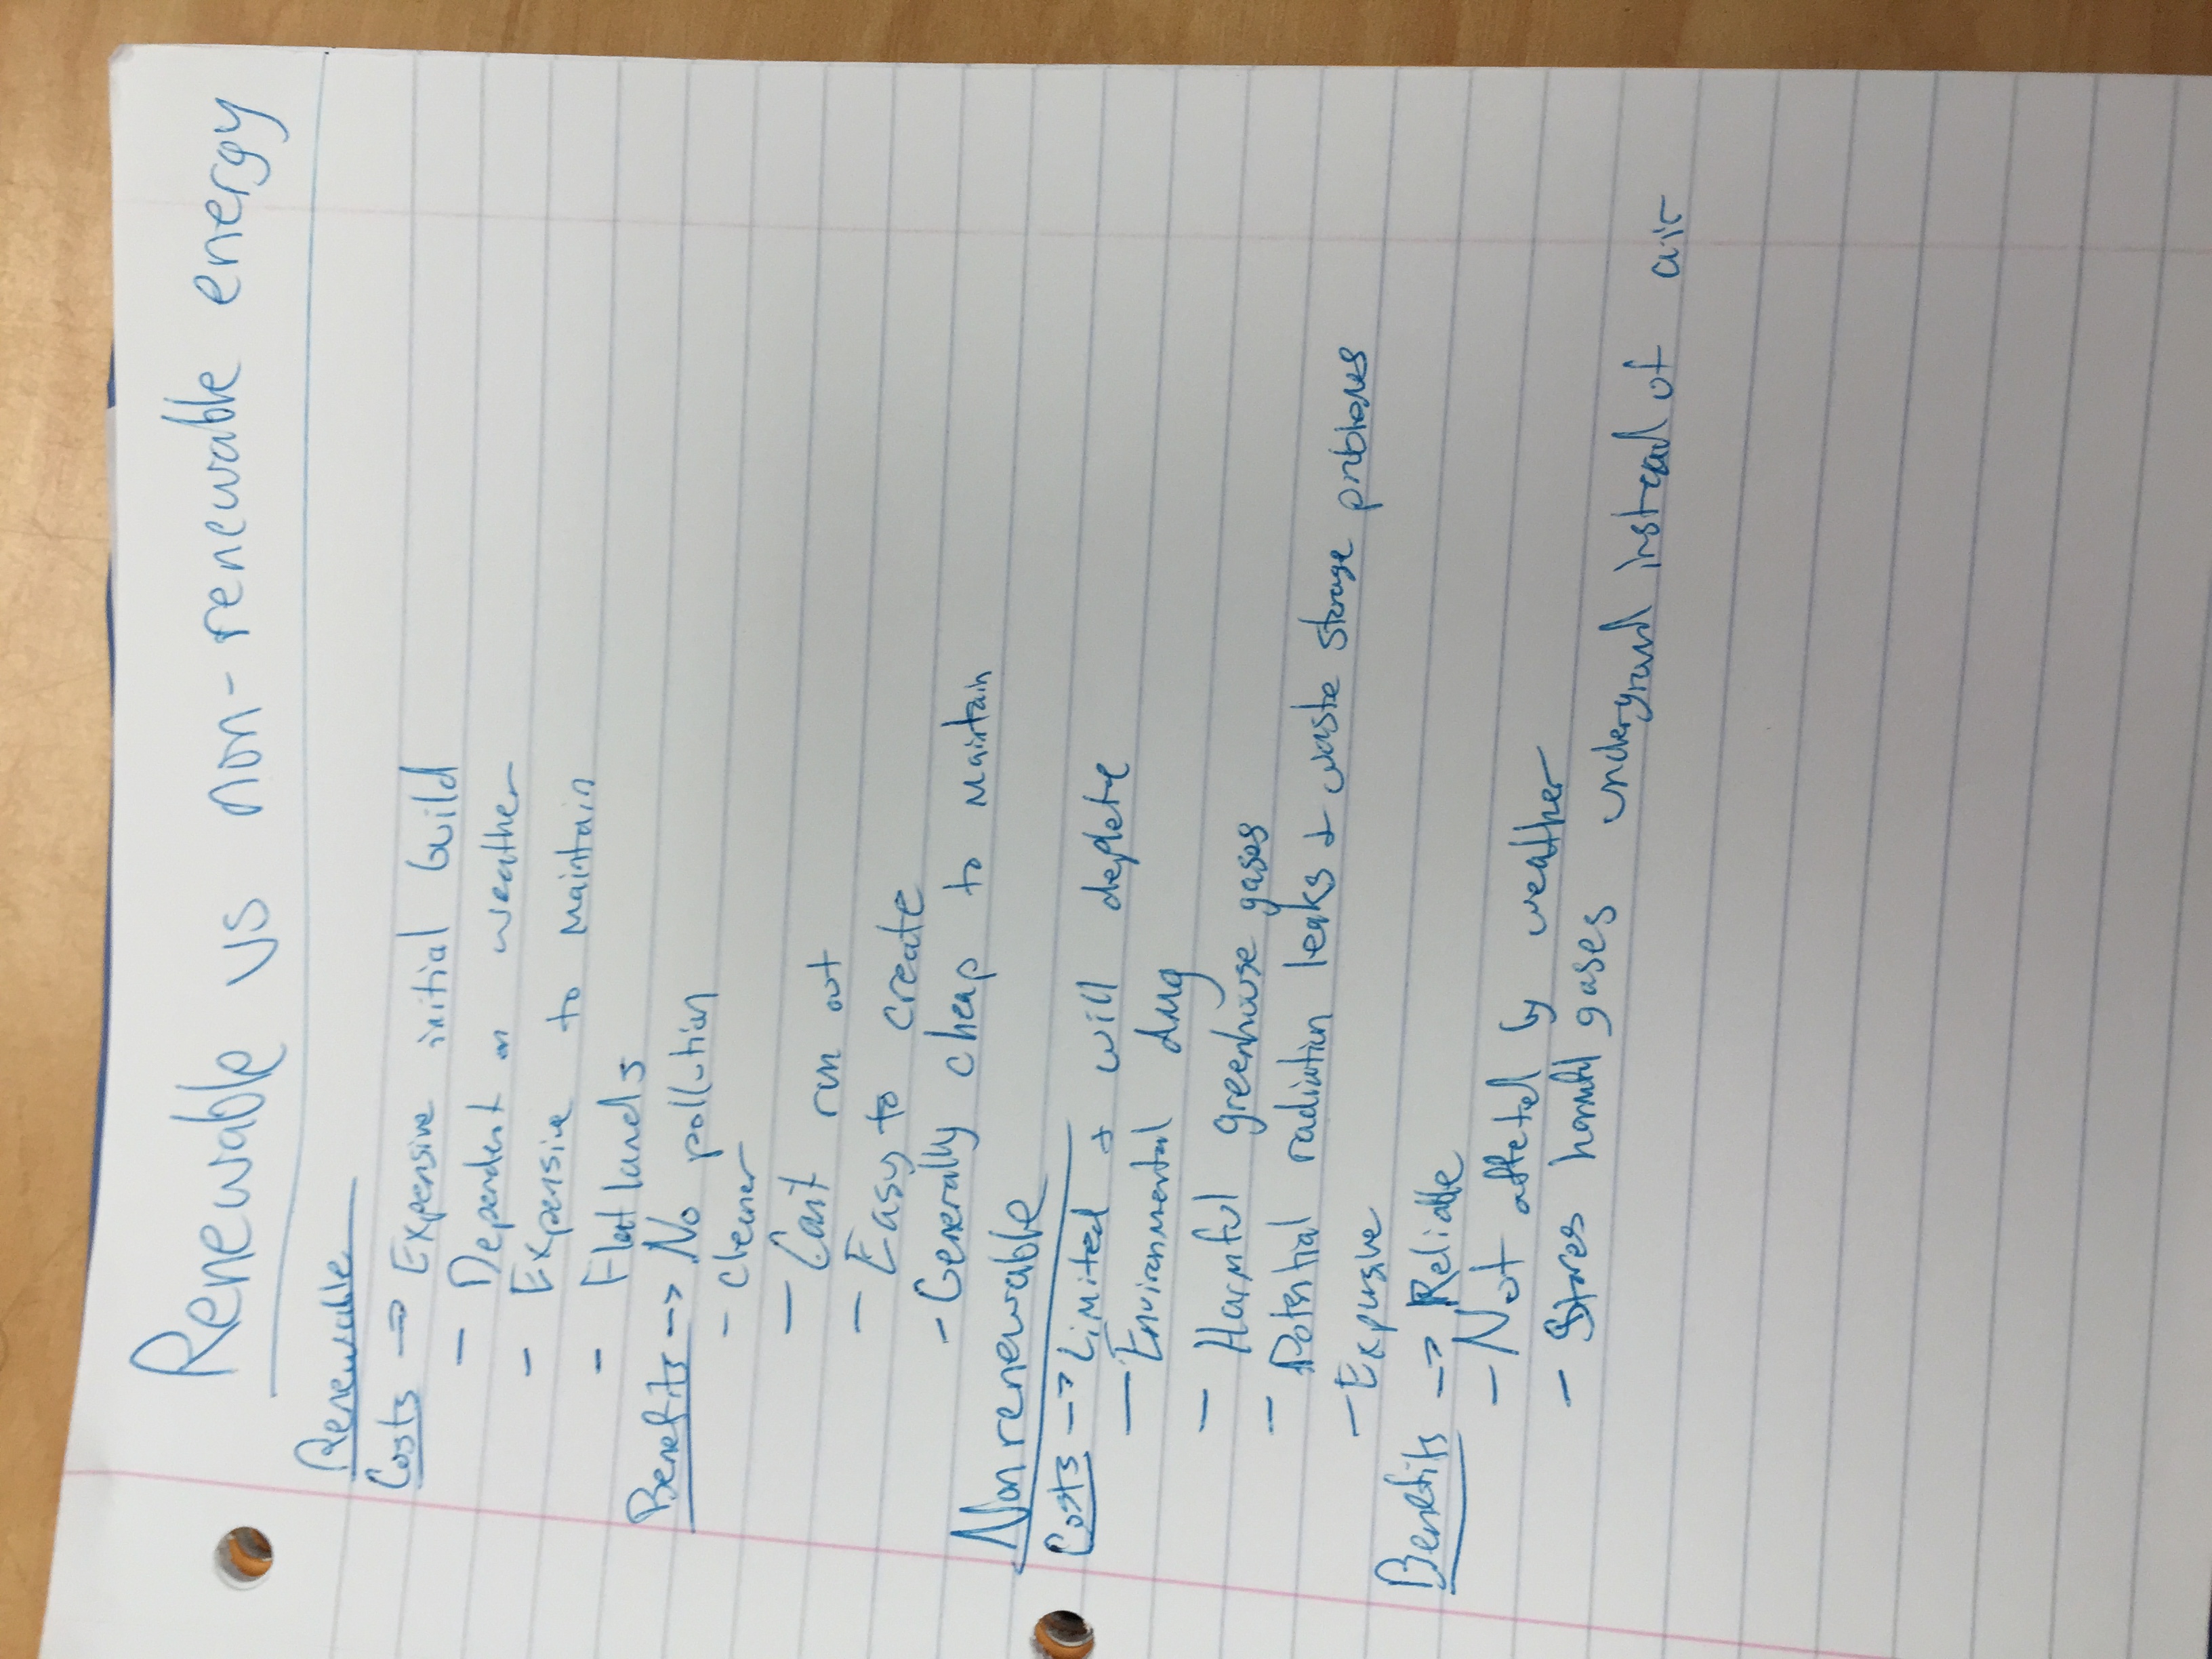
Use the website Renewable v Nonrenewable resources to compare and contrast costs and benefits of renewable V non renewable resources.
Do Now 1: prepare for a 1 minute group presentation and questioning on Ocean Levels project.
Do Now part 2 in link in power point you will see when opening the above link
Do Now 14: Use this article to compare and contrast niche versus habitat
TSW analyze nutrient cycles using county provided biogeochemicals ADI.
Nitrogen Cycle
Use the website Renewable v Nonrenewable resources to compare and contrast costs and benefits of renewable V non renewable resources.
Ecology
Review and Practice Exam
REVIEW AND PRACTICE EXAM
The exam review was made by me. The test may contain material NOT APPLICABLE to our class, so only use the questions that cover material we learned :)
Test Day Do Now:
1. Differentiate between the three population dispersion patterns: clumped, uniform, random and use evidence to justify why the different patterns exist.
2. Differentiate autotroph and heterotroph using this article.
Disclaimer: None of the material or lessons found on this website may be reproduced for profit. All material is intended for free use.
